Hope Foundation Annual Report
An interactive digital report showcasing impact for a mission-driven nonprofit
Hope Foundation Annual Report
The Hope Foundation is a nonprofit organization dedicated to improving educational outcomes for underserved communities. They needed to transform their traditional PDF annual report into an engaging digital experience that would inspire donors and showcase their impact.
The Challenge
Traditional annual reports face several challenges:
- Low Engagement - PDFs are rarely read cover-to-cover
- Static Data - Numbers on a page don't tell compelling stories
- Poor Mobile Experience - PDFs aren't mobile-friendly
- Limited Shareability - Hard to share specific achievements
- Accessibility Issues - PDFs often fail accessibility standards
Hope Foundation wanted something different: a digital experience that would make their data come alive and inspire action.
Our Approach
We proposed an interactive web-based annual report with:
Key Features
- Data Visualizations - Animated charts and graphs
- Storytelling - Personal stories from beneficiaries
- Interactive Elements - Explore data at your own pace
- Mobile-Optimized - Beautiful on all devices
- Shareable - Easy to share specific sections
- Accessible - WCAG AA compliant throughout
The Solution
Homepage
The homepage sets the tone with:
- Year-in-review video
- Key achievements highlighted
- Navigation to main sections
- Call-to-action to donate
Impact Dashboard
We created an interactive dashboard showing:
- Students served (12,450)
- Schools partnered with (87)
- Scholarships awarded ($2.3M)
- Volunteer hours (34,000)
Each metric includes:
- Animated counters
- Year-over-year comparison
- Breakdown by region
- Deeper dive capabilities
Data Visualizations
Using D3.js, we built custom visualizations:
Student Outcomes
An animated bar chart showing:
- Graduation rate improvements
- College acceptance rates
- Scholarship recipients
- Career placements
Geographic Impact
An interactive map displaying:
- Programs by location
- Students served per region
- Resource allocation
- Growth over time
Financial Breakdown
Transparent financial data showing:
- Revenue sources
- Program expenses
- Administrative costs
- Future projections
Personal Stories
Data alone doesn't inspire - stories do. We featured:
- Student Spotlights - Success stories with photos
- Volunteer Testimonials - Why people give their time
- Partner Quotes - School administrators share impact
- Donor Profiles - Major supporters explain their "why"
Each story includes:
- Portrait photography
- Pull quotes
- Video testimonials
- Related metrics
Technical Implementation
Animations
We used Framer Motion for smooth, meaningful animations:
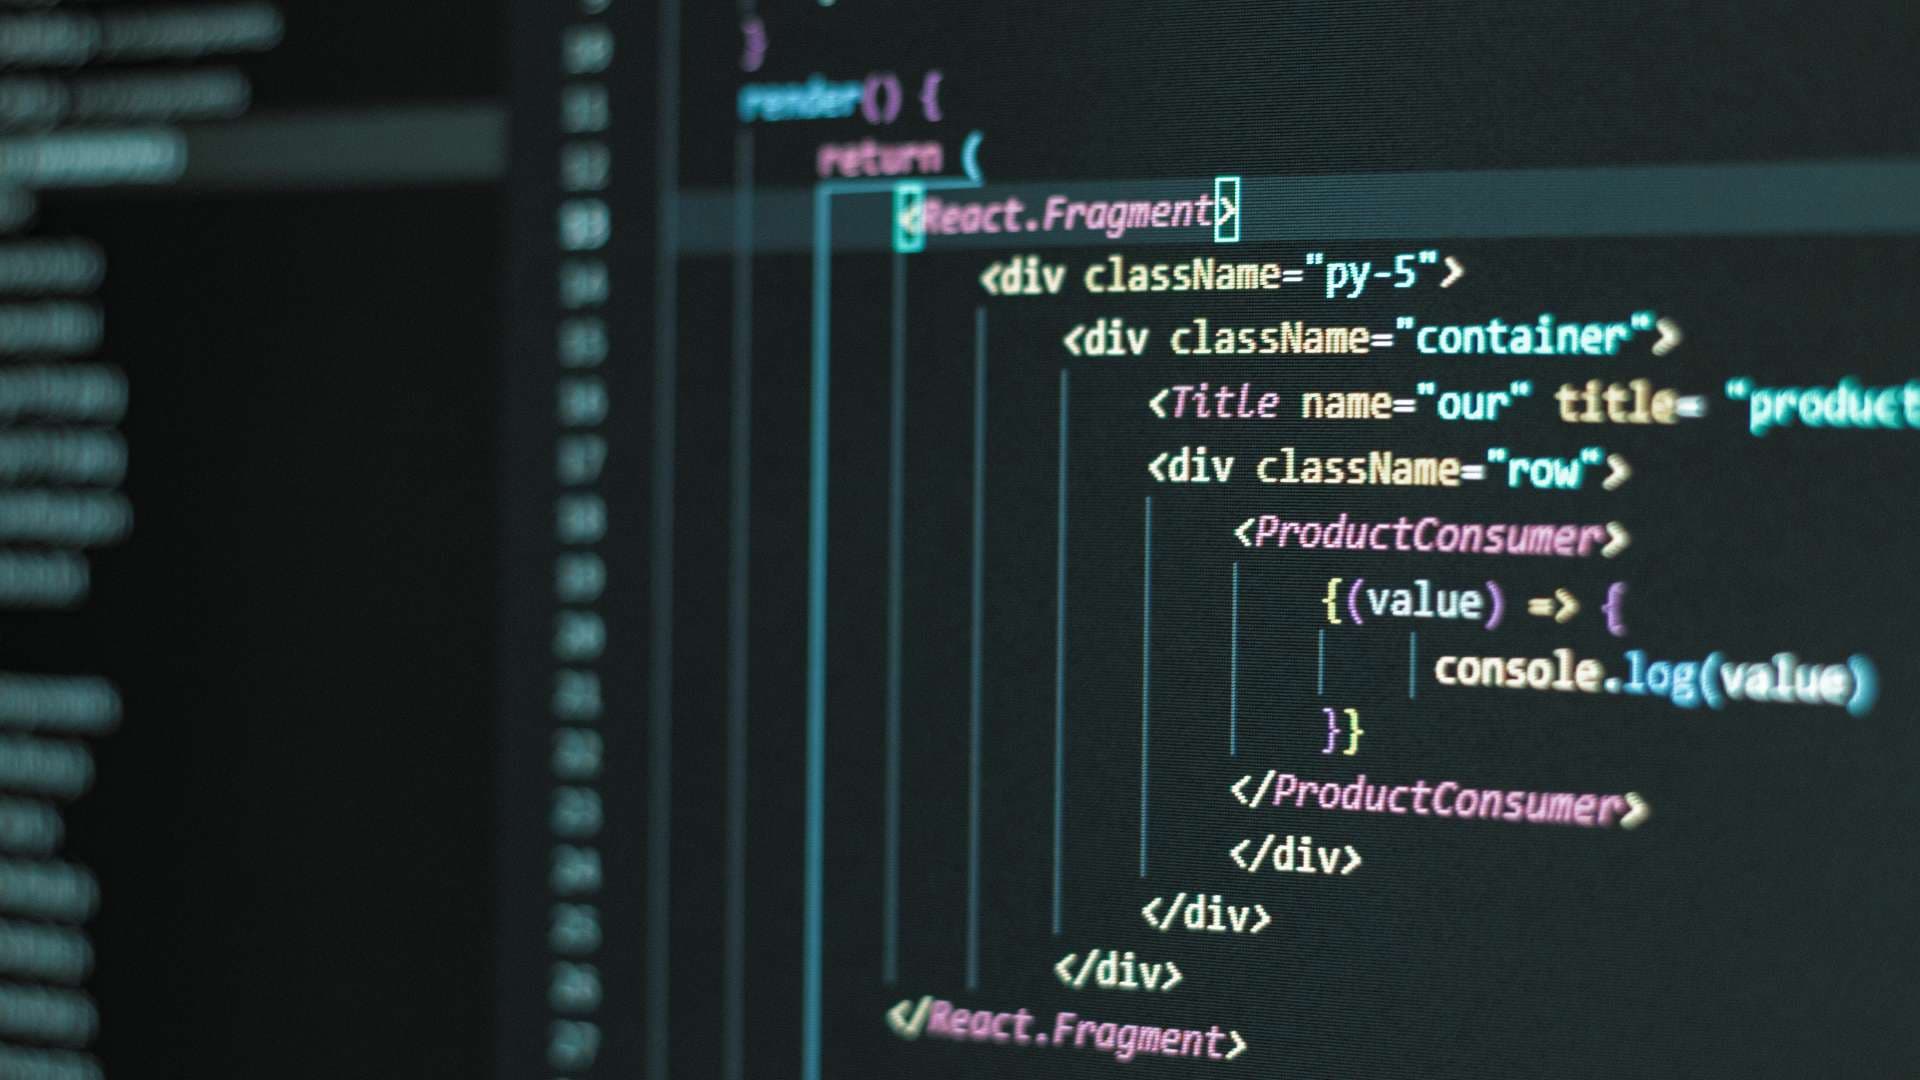
// Example: Animated counter
import { motion, useSpring, useTransform } from 'framer-motion'

function AnimatedCounter({ value }) {
  const spring = useSpring(0, { duration: 2000 })
  const display = useTransform(spring, (val) => Math.round(val))

  useEffect(() => {
    spring.set(value)
  }, [value])

  return <motion.span>{display}</motion.span>
}
Animations include:
- Number counters
- Chart reveals
- Scroll-triggered content
- Smooth page transitions
Data Visualization
D3.js powers all custom charts:
- Responsive sizing
- Accessible color palettes
- Interactive tooltips
- Smooth transitions
- Mobile-optimized interactions
Performance
Despite rich visuals, we maintained:
- Lighthouse Score: 94
- First Contentful Paint: 1.4s
- Time to Interactive: 2.3s
- Smooth 60fps animations
Accessibility
Every element is accessible:
- Keyboard navigation
- Screen reader support
- Alt text for all images
- ARIA labels for charts
- High contrast mode support
Results
The digital report was a massive success:
Engagement Metrics
Compared to the previous year's PDF:
- Time Spent: 8.2 minutes (vs. 1.3 minutes)
- Completion Rate: 67% (vs. 12%)
- Share Rate: 34% of visitors shared (vs. 3%)
- Mobile Views: 58% (vs. 8% who downloaded PDF on mobile)
Business Impact
- Donor Inquiries: +156% increase
- Small Donations: +89% increase
- Major Gifts: 3 new six-figure commitments
- Volunteer Applications: +127% increase
Media Coverage
The innovative approach attracted attention:
- Featured in NonProfit Quarterly
- Shared by education policy organizations
- Referenced in fundraising best practices
- Won Digital Innovation Award
Client Feedback
"This annual report didn't just inform - it inspired. We've had more engagement with our stakeholders this year than in the past five years combined. The team at Agency truly understood our mission and helped us communicate our impact in a powerful way." - Dr. Lisa Martinez, Executive Director, Hope Foundation
Interactive Features
Compare Years
Users can toggle between years to see:
- Growth trends
- Program evolution
- Impact increases
- Financial changes
Filter by Program
Explore specific programs:
- After-school tutoring
- College prep workshops
- Scholarship programs
- Mentor matching
Download Center
For those who still want PDF:
- Printable summaries
- Infographics
- Financial statements
- Impact one-pagers
Technical Stack
- Next.js 14 - Framework and SSG
- D3.js - Custom visualizations
- Framer Motion - Animations
- Tailwind CSS - Styling
- TypeScript - Type safety
- Vercel - Hosting and analytics
Key Learnings
This project taught us valuable lessons:
- Data needs stories - Numbers alone don't inspire action
- Accessibility first - Design with all users in mind from the start
- Mobile matters - Over half of views were on mobile
- Performance budget - Even beautiful sites must be fast
- Shareability drives reach - Make it easy to share wins
Future Enhancements
We're planning additions for next year:
- Real-time impact dashboard
- Monthly mini-reports
- Donor portal with personal impact
- Interactive goal tracking
- Community forum
Ready to transform your organization's storytelling? Let's create something amazing together.